
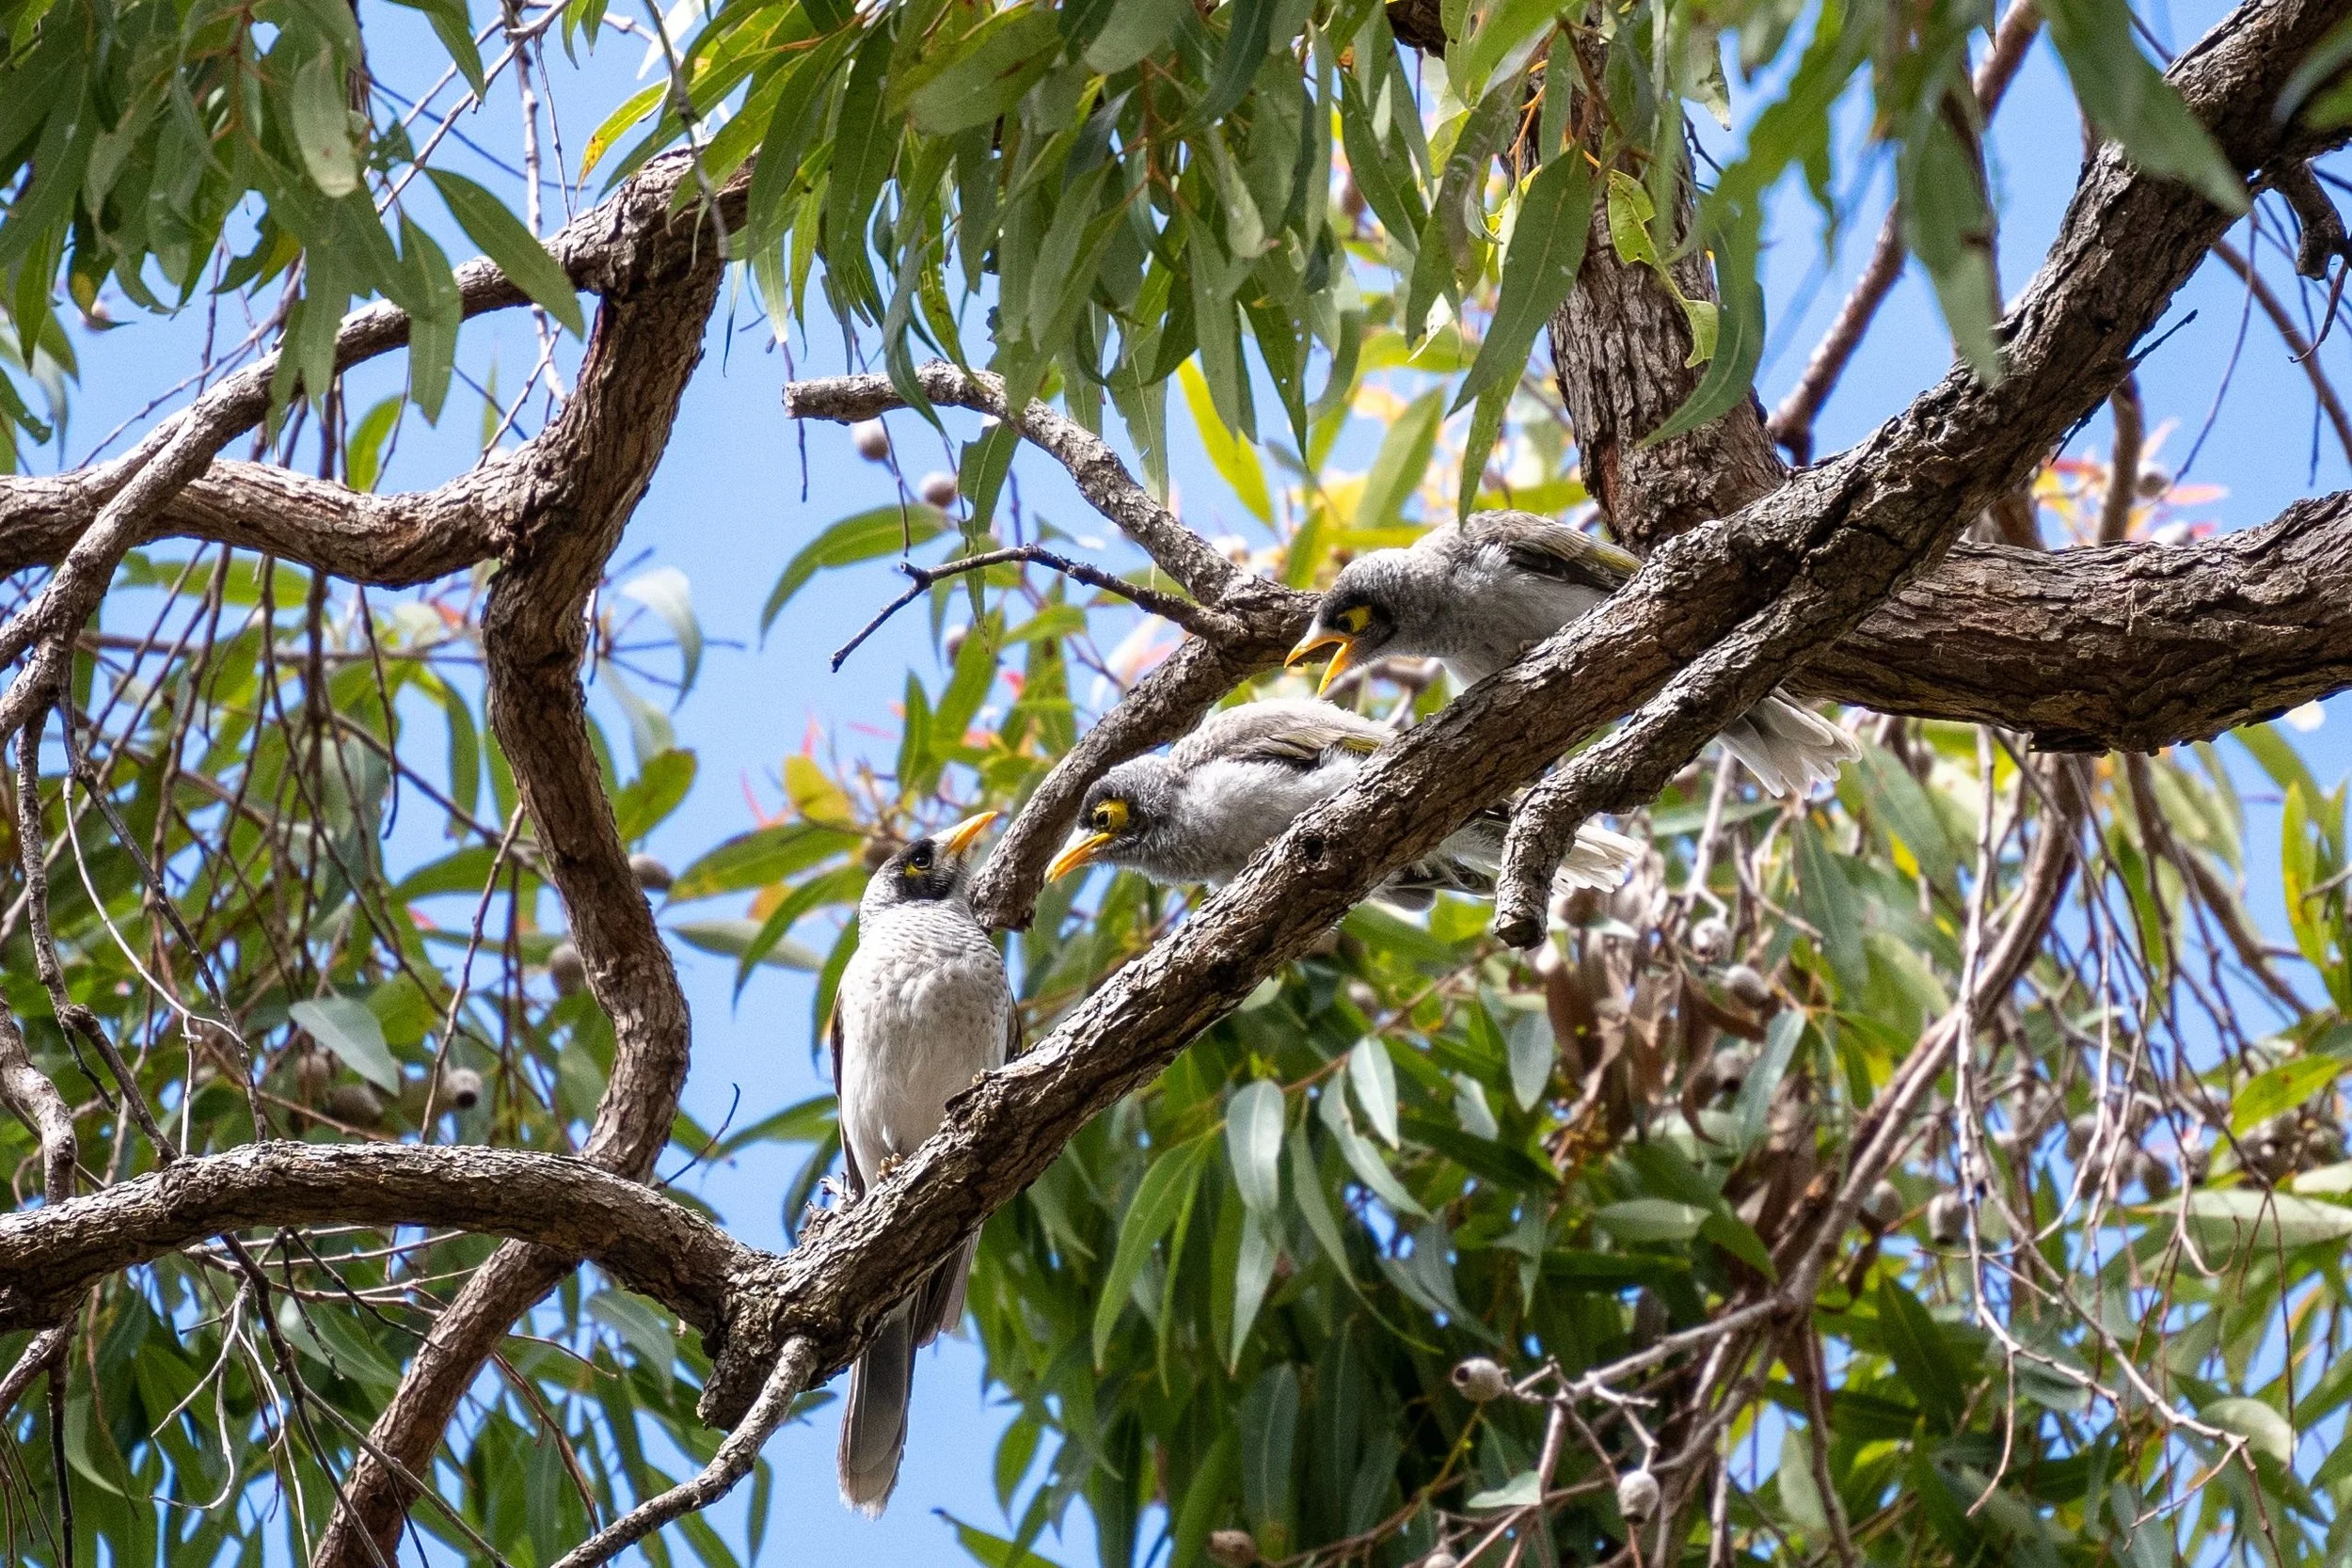
The Noisy Miner (Manorina melanocephala) is a native Australian honeyeater, but in some landscapes it can become extremely abundant and aggressively exclude other birds from otherwise suitable habitat.
Noisy Miners are highly social and territorial. Where populations become over-abundant, their aggressive behaviour can contribute to the exclusion of smaller woodland bird species.
This is particularly important in Australia's temperate woodlands, where habitat loss and fragmentation are already placing considerable pressure on bird communities.
As part of its Woodland Birds Program, BirdLife Australia has been investigating how Noisy Miner management and habitat restoration can contribute to the recovery of woodland bird diversity. One outcome of this work was a series of spatial models. The next challenge was turning those research outputs into something land managers could easily use for their own sites.
Working with BirdLife Australia, TerraLab developed a web GIS application that does exactly that.
Rather than asking users to interpret large raster datasets or undertake their own spatial analysis, the application lets them draw their study area on a map. Behind the scenes, GIS processes query the research models, analyse the site and surrounding landscape, create maps, compile the results into a report and automatically email it to the user.
It's a good example of how web GIS development can turn complex spatial research into a practical online decision-support tool.
From research raster to web GIS application
The ecological modelling behind the project had already been undertaken by the research team. Our role was to develop the GIS infrastructure that would allow people to interact with those results.
The model outputs were spatial raster datasets, with values varying across the modelled landscape.
For a GIS analyst, accessing this information is relatively straightforward. Load the raster, obtain the area of interest, run the appropriate spatial analysis and interpret the resulting values.
That's less practical if potentially hundreds of land managers need to do it.
Instead, the web GIS application automates that process.
The research datasets sit behind the application, while the user interacts with a much simpler online map.
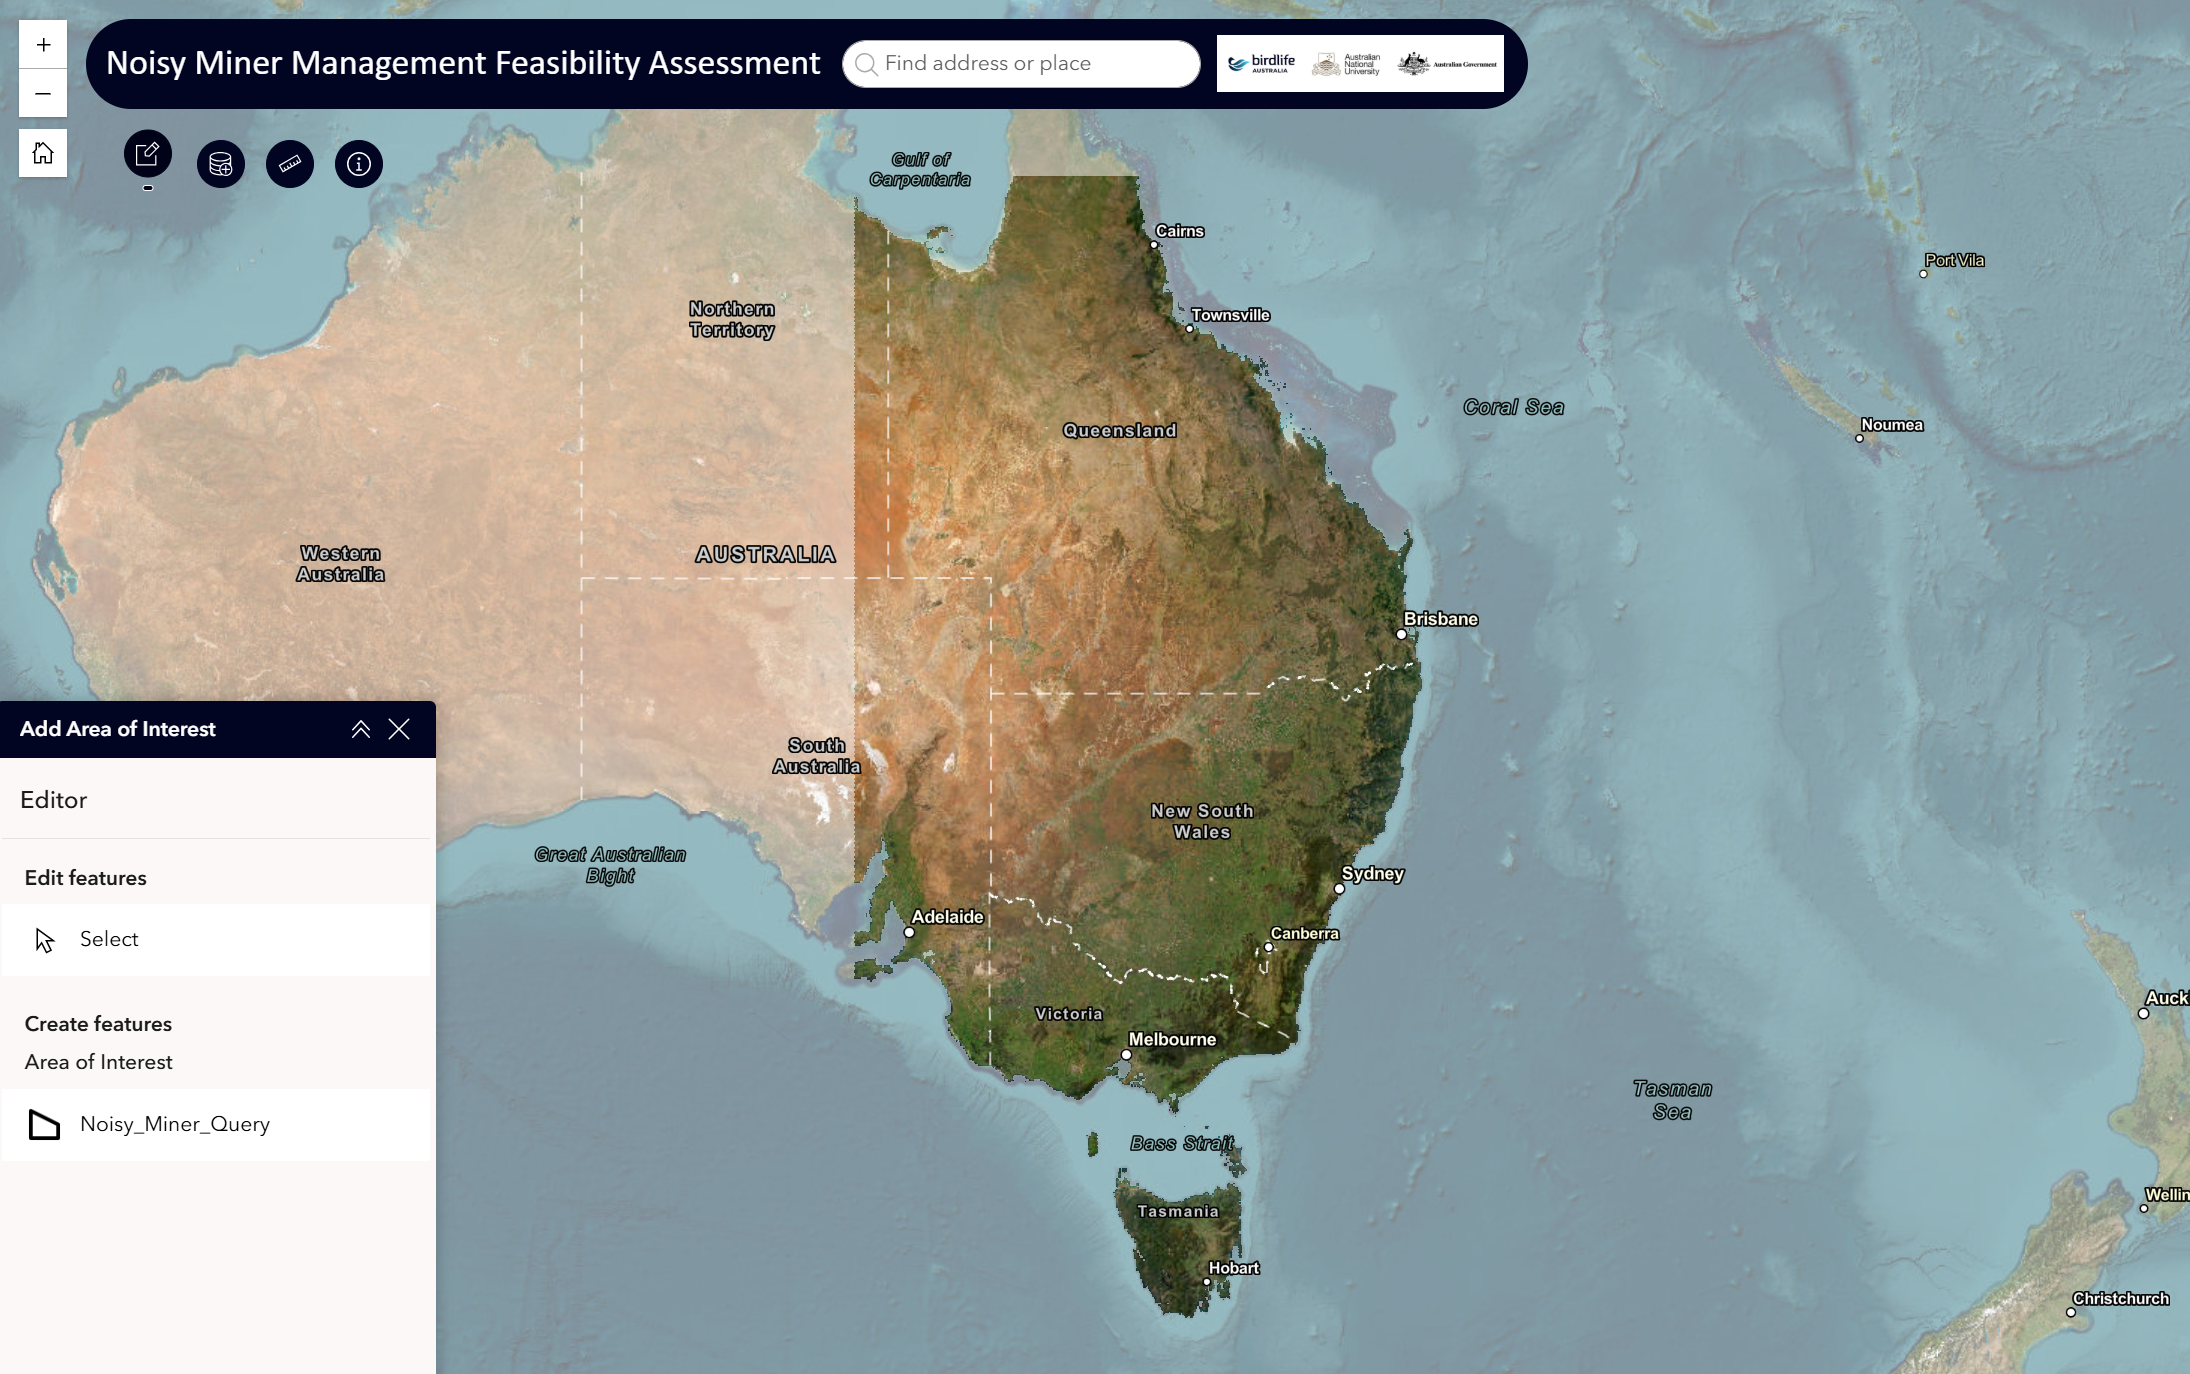
Noisy Miner Management Feasibility Assessment web tool.
Drawing a site rather than operating a GIS
The starting point for the user is simply their area of interest. Users navigate to their site through the interactive web map and draw a polygon around their property, reserve, restoration area or other study site. That polygon becomes the spatial query.
Once submitted, the application takes the user-generated geometry and automatically interrogates the underlying raster datasets produced through the research project.
This is one of the advantages of building a GIS web application around an existing spatial model. The technical GIS processes don't disappear, but they can be hidden from the end user. The user doesn't need to download a raster, understand cell values, perform spatial statistics or prepare maps.
They just need to tell the application where their site is.
Automatically querying the research models
The application uses the submitted polygon to derive site-specific information from several underlying spatial models.
These include Expected Noisy Miner Habitat Suitability, Expected Woodland Bird Diversity and Habitat Restoration Potential. The Noisy Miner assessment also considers the surrounding landscape, with expected relative abundance calculated for a 5 km area around the user's site.
Each model answers a different ecological question.
Expected Noisy Miner Habitat Suitability is based on the likely proportion of the local honeyeater community represented by Noisy Miners.
Expected Woodland Bird Diversity estimates the site's value for 35 woodland bird species, with greater weighting given to threatened species.
Habitat Restoration Potential predicts the potential value of an area to woodland birds if habitat restoration were undertaken, considering factors including existing habitat quality, soil fertility and proximity to important habitat and riparian areas.
From a web GIS development perspective, the important part is that these research outputs exist spatially. Every location across the modelled landscape has an associated value. By overlaying the user's polygon with those raster surfaces, the application can translate a large regional research dataset into information relevant to one particular site.
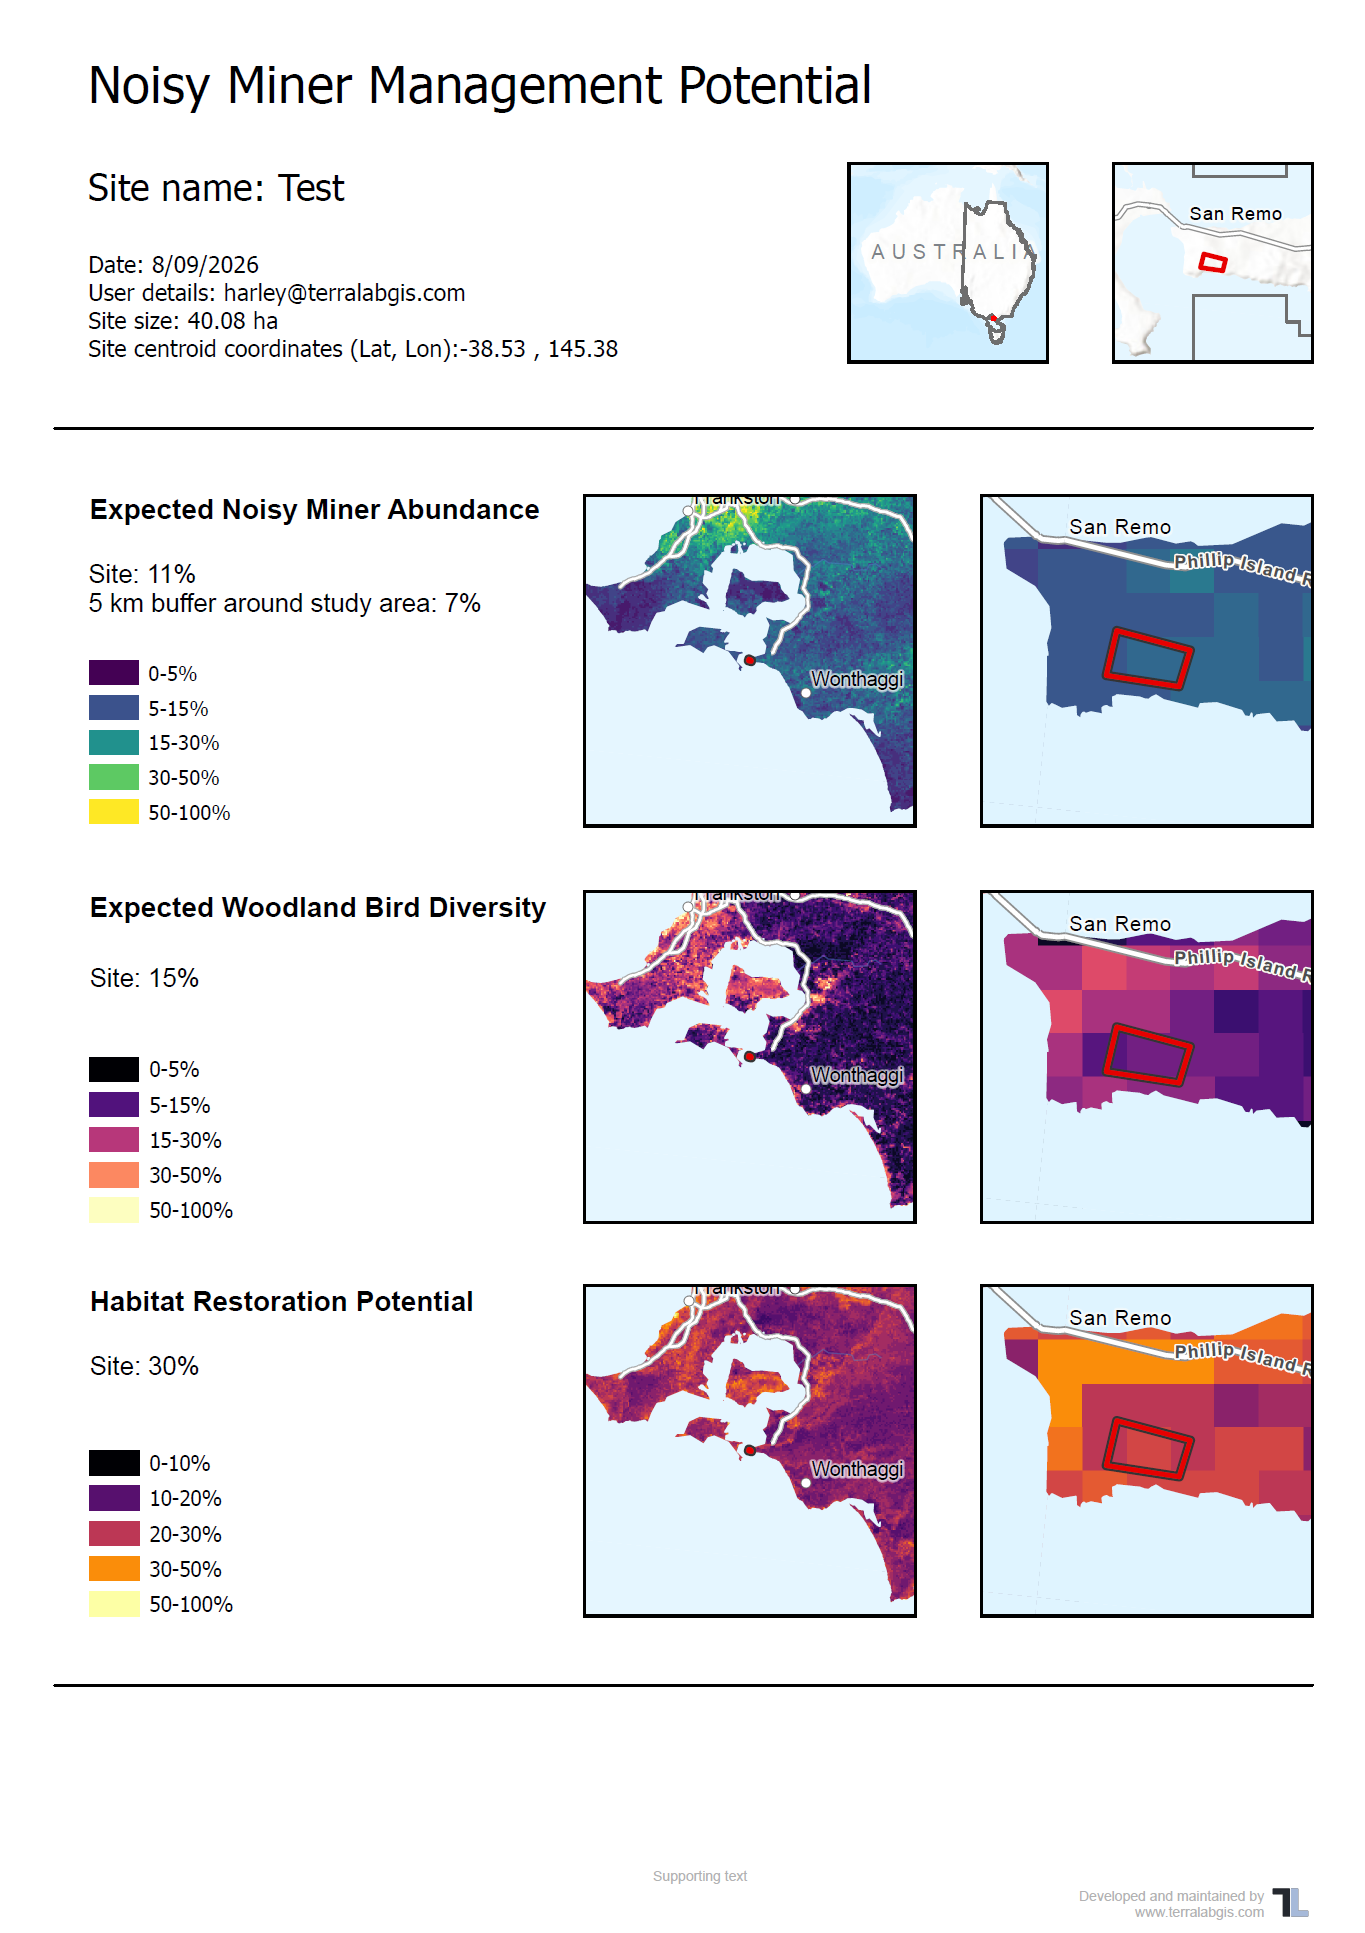
The Noisy Miner Management Potential Report
The automated report the user receives.
Using GIS to look beyond the property boundary
Not all ecological questions stop at the edge of a property. This was particularly important for the Noisy Miner component of the application.
The tool considers both conditions within the study area and expected Noisy Miner abundance in the surrounding 5 km landscape. This matters because a site with relatively few Noisy Miners immediately surrounding it may present a very different management opportunity to an isolated treatment area surrounded by a large predicted population.
BirdLife's guidance notes that higher predicted abundance in the surrounding landscape may increase the potential for recolonisation following control. The web GIS application handles this additional spatial analysis automatically. The appropriate surrounding area can be generated and the raster queried without requiring anything further from the user.
It's a relatively sophisticated spatial question presented through a very simple interface.
From a user-drawn polygon to an automated report
Querying the spatial models is only part of the workflow. Once the analysis has been completed, the application takes the results and automatically generates a report specific to that site.
The report includes information about the submitted area, including its size and centroid coordinates, together with maps showing the site's position within each of the modelled spatial datasets.
For example, the automatically generated report presents regional and site-scale maps for Habitat Restoration Potential, Expected Woodland Bird Diversity and Expected Noisy Miner Abundance alongside the calculated results. The finished report is then emailed directly to the user.
From the user's perspective, the workflow is essentially:
Draw a polygon → submit → receive a site-specific spatial assessment by email.
Behind that simple process, the application has handled the geometry, queried multiple raster datasets, analysed the surrounding landscape, extracted results, generated maps, populated a report and delivered it.
Making spatial research accessible through web GIS
This project demonstrates an area of GIS that sometimes receives less attention than the mapping and modelling itself.
Producing a spatial model can provide valuable new information, but its usefulness may be limited if the people who could act on it need specialist GIS software or technical expertise to access the results.
A web GIS application can provide the missing link between spatial research and its end users.
Instead of distributing the underlying datasets and expecting users to undertake their own analysis, the analysis can be built directly into an interactive mapping application.
In this case, a land manager doesn't need to ask a GIS analyst to extract their property, query several datasets and prepare a series of maps. They can access the same underlying spatial information themselves and receive an assessment tailored to the exact area they're interested in.
The process is also repeatable. The same analytical workflow can be applied consistently every time someone submits a new site.
Web GIS as the link between research and management
We often think about GIS as a tool for creating maps or undertaking spatial analysis. Increasingly, some of its most useful applications involve building systems around that analysis.
BirdLife Australia's research provided the ecological models. The web GIS application provides a way for those models to be queried by the people who can use the information on the ground.
For TerraLab, that's one of the more interesting aspects of web GIS development: taking complex spatial datasets, models or analytical processes and building an application that makes them accessible to people who don't necessarily use GIS themselves.
The end result can be very simple for the user, even when there is considerably more sophisticated spatial analysis happening behind the scenes.
You can learn more about the research and the Noisy Miner Management Potential tool through BirdLife Australia's Woodland Birds Program.
Have spatial data that could become an online tool?
TerraLab develops web GIS applications, interactive mapping tools and automated spatial workflows for environmental management, research and natural resource management projects.
If you have research outputs, spatial models or GIS datasets that you'd like to make accessible to clients, land managers or the broader community, contact TerraLab to discuss your web GIS application.